
I am privileged to have the opportunity to pen a guest post at The Azimuth Project blog, in two parts, concerning the question of whether or not there is a slowdown in warming in global mean surface temperature. It is called “Warming Slowdown?” and it appears in two parts, with much discussion in comments both at the blog, and in a Google+ forum related to the blog. These are:
I must say learning and keeping up with the literature, preparing the text, and editing it into final took some effort, which I could not have done without Professor John Carlos Baez’ encouragement and hard work.
Enjoy!
Some of the codes used to prepare the figures for this post are and will be available.
(Addendum, 7th June 2014, 10:20 ET)
In discussions regarding the second installment, Graham Jones applied a lowess smoother to the temperature residuals discussed in the above. Applying the estimate of first time derivative done there, produced the very nice plot shown below. Note the uninterrupted warming, and, in fact, acceleration of warming. There is also no evidence from lowess for a slight global cooling before 1940 as has been reported in some places.

(Click to see larger image.)
(Addendum, 10th June 2014)

(Click to see larger image.)
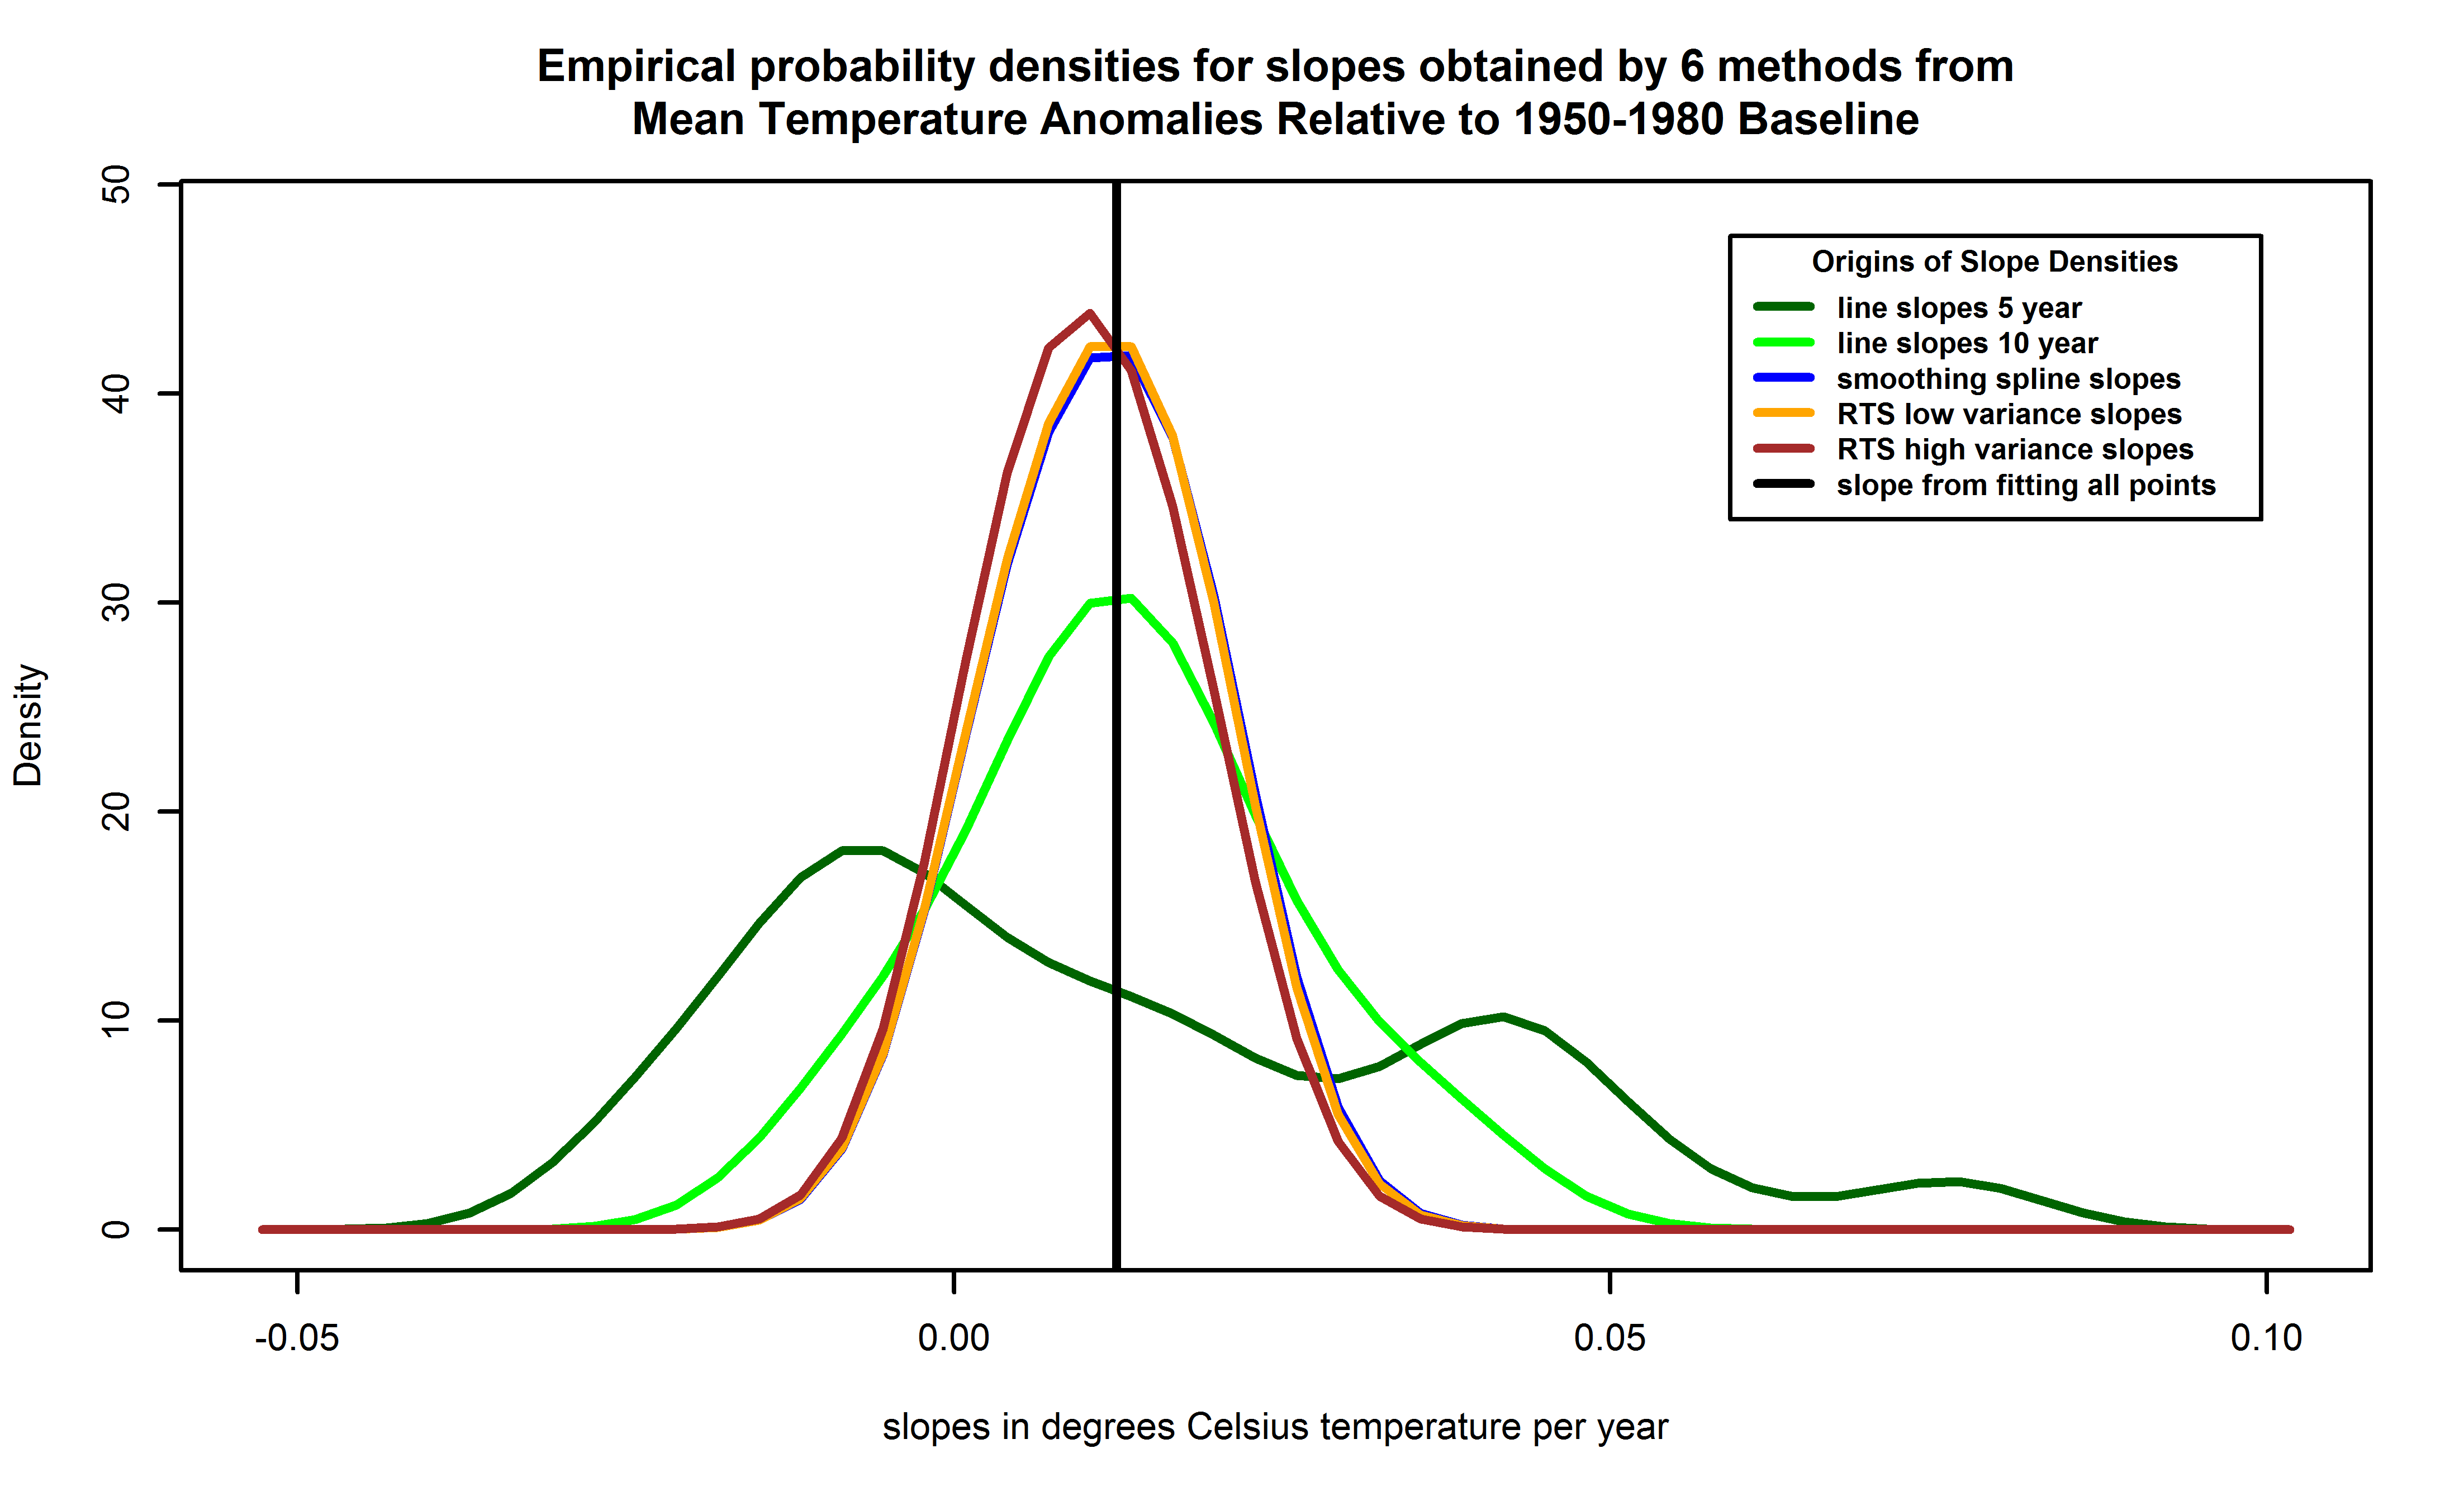
Note how this compares with Figure 14 in “Warming Slowdown? (part 2 of 2)“, and Figure 15, itself Figure 1 of Fyfe-Gillet-Zwiers, referenced therein. Caution: The Figure 14 is in units of anomaly per year, not per decade like the other two figures.


Better Bayesian estimate for trend from GLBSSST http://azimuth.ch.mm.st/WarmingSlowdownQ/BetterBayesianOverallTrendFigure.png. Code is at http://azimuth.ch.mm.st/WarmingSlowdownQ/BetterBayesianTrending.R. Run history is at http://azimuth.ch.mm.st/WarmingSlowdownQ/20140610BetterBayesianTrends.Rhistory. Workspace after run is available at http://azimuth.ch.mm.st/WarmingSlowdownQ/BayesianTemperatureTrends-GLBSSST.RData.
Again this uses R and JAGS.