
What’s the Question?
A question was posed by a colleague a couple of months ago: What are the odds of a stock closing at the same price it opened? I found the question interesting, because, at first, it appeared to be a one-dimensional version of another problem I looked at here, which was in two dimensions. Well, I have produced an estimate, and am reporting results here. My first impressions of the problem were wrong. It actually is a two dimensional problem, not a one dimensional one. And it is not the same as the earlier problem, because although one of its dimensions is discrete, the other, time, is (essentially) continuous. I’ll explain.
The Data
I obtained intraday trades, or “Time & Sales” records (as they are called) for a single stock on the NASDAQ for a 71 day period. The stock was the one my colleague asked about. This series consisted of 679,390 original records. After discarding corrections (about 1.1%), there were 679,314 records remaining. I also discard unnecessary columns, retain date, time, and price. The times are recorded in U.S. Central Standard Time and are available to millisecond resolution, although the source of the data assumes no responsibility on time accuracy, saying this portion of the data is what they get from the NASDAQ and they copy it. Prices are reported to cents resolution.
The data was grouped into days, and, so, there was a times series of trades within each day. The price of the first trade of the day was subtracted from the prices of the remaining trades and, so, the trades of each day are references with respect to the opening price. A net zero condition such as is indicated by the title of the blog post is if, therefore, the transformed final price of a day is zero, or, in actuality, within a penny of zero. The objective of the study is to estimate the odds of that happening.
The Data and Code are Provided for Examination
I am providing data and code supporting this study. There are available in an Atlassian Bitbucket a Git repository in a publicly accessible Google Drive folder. In the provided data, I have omitted the ticker symbol, the base prices, the record flags, and the date portion of timestamps from these data, because:
- There’s no reason to mention the publicly traded company involved.
- I am not a financial advisor and I don’t want to run afoul of rules about seeming to give advice when I’m not.
- I want to be able to provide the data so readers and students can reproduce what I did, but I don’t want to violate Terms and Conditions on the use of the data I obtained to support this from the site I purchased them.
Also, in the dataset provided, the dates have been replaced with a trading day number. These are all done to preserve the anonymity of the stock. For the study, all that’s needed is some label to group records together. Also, the data provided is the transformed data with the open trade price subtracted. Again, by removing the magnitude of the price, I’m attempting to protect stock anonymity. I have also provided a copy of the code which was used to perform the transformation.
Also, the size of the data, based upon 71 days, was arbitrary. On the one hand, it could be thought of as a cost constraint, that is, more data could cost more. If I’m having fun answering a question like this and writing it up, it might as well be one where some constraints typical of studying more serious questions arise. On the other hand, 71 days of intraday trading data isn’t negligible.
Approach
It’s possible to apply analytical models to the problem, and it’s almost unavoidable to use some theory for reasons that’ll be explained in the material to come. I also understand that this problem, with suitable assumptions, is a question addressed in standard financial trading studies, such as the result that the variations in stock prices intraday are t-distributed. Ultimately, and apparently, for large sets of stocks, daily fluctuations depend upon order flows. See J. C. Hull, Options, Futures, and Other Derivatives, 5th edition, Prentice-Hall, 2003, for more of this kind of theory.
For such a specific question, though, with such a limited dataset, I tend to avoid using models which depend on assumptions about the process at hand, or rely upon asymptotics. I also try to make as few distributional assumptions as I can, letting the data and its interaction with the question at hand speak for themselves. I would have liked to use a t-distribution for the variations in the model, but neither of the two Kalman filtering R packages I typically use, dlm and KFAS, offer such an option. It was important to use a package which could estimate time-varying covariances on its own, since these signals are not stationary.
That said, it is nevertheless true that no purely empirical approach will given a good answer with this dataset. The closest any close gets to the opening price in this 71 day dataset is a penny, and there are only two days when that is true. That would produce an estimate of zero odds. That not only violates Cromwell’s Rule, but it is wrong, because on a day after this dataset was compiled this stock did close at its opening. In fact, that event prompted the question.
The idea I chose was to model the movement of the stock from its open on any day to its close as a random walk, one that I’ve described before:


Here 


The idea of using 71 sets of data are to characterize both 

On the Form of
For the purposes here, 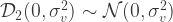
On the Form of
While dependence of 

and so that question is finessed because, despite the “chunkiness” of the trades, the result of the penalized spline is a continuous Real. Accordingly, the resulting disturbance has the same form as 

Implementation
To the accuracy of consideration, which is a trading time stamp resolution of one second, many observations in Time & Sales records are recorded at the same moment. Accordingly, these records are first pre-processed to keep only the latest trade for any given moment, so defined. There are 23,400 seconds in the trading day.
For each day of trades, the P-spline is calculated for the each of the intradays trading histories, and these are migrated onto the regular grid of trading seconds. There are 71 such days in the dataset. An example of such an interpolation, with data overprinted, is given in the figure below. It is from day 24 of the dataset:

(Larger version of figure can be seen by clicking on the above. Use your browser Back Button to return to blog.)
Next, a filtering, smoothing Kalman filter is applied to the 71 days of trades, seen as a 71-variate response with a common state and covariance terms. The covariances are estimated from the data using maximum likelihood. They are allowed to vary throughout the trading day.
Given the fitted model, 100 instances of the estimated states and 
A histogram of the 100 means from the final states is shown below:
 (Larger version of figure can be seen by clicking on the above. Use your browser Back Button to return to blog.)
A histogram of the standard deviations (not variances) of the noise terms for each of the 100 simulations is shown below:

(Larger version of figure can be seen by clicking on the above. Use your browser Back Button to return to blog.)
These means and variances are treated as a mixture distribution of 100 Gaussians with the given 100 means and their corresponding 100 variances. Choices of which Gaussian is used in any instance are weighted equally, and 100,000 samples are drawn from this mixture. This is based upon a plan by Jack Baker from his vignette for the sgmcmc package, although here only univariates are drawn for each sample, and the code is a little different.
The number of trading days ending at an offset trade price within a penny of zero are counted, and the fraction of the total is taken as the probability of the intraday offset price or total net trades being zero.
The probability so derived is about 0.015, maybe a little less.
What this means in terms of waiting time, using a negative binomial model, is that the expected number of trading days before the first net zero is 


Criticisms
There are two shortcomings in the above calculation.
First, because there’s a need to register all trading days on a common time grid, by migrating stock prices using interpolation, it is possible the variance of the original dataset has been reduced. Surely, this is suggested a bit from the figure of the interpolation with points on top of it above. This is an unfortunate requirement of using the Kalman filter approach to estimation. It might be possible to correct for this effect by inflating the variance terms. However, it is also possible that the scatter observed in the figure is due to the chunkiness (“to the penny”) with which stock trades are reported and the stock price is effectively between two ticks.
Second, the distribution assumed for stock variation is Gaussian, primarily because the KFAS package does not, at present, support a t-distribution as one of its modeling options. Were that to be available, it would be interesting to repeat this calculation.
The effect of both these criticisms would be to reduce the probability of total net trades being zero. Accordingly, it seems leaving the probably at 0.01 or 1% is a good estimate, even if it needs to be corroborated by the two criticisms being addressed.


